Will Grow is a strawberry farmer. He wants to move to a new location in California where he can have optimal conditions for growing his crop. Local government has offered him plots of land in three different regions within the state to set up a new farm: Fresno, Sonoma and Barstow. Before he decides on where to move, a suitability analysis must be done to determine which city has the most favorable climatic and locational conditions for cultivating and selling strawberries.
Strawberries are perennial berries that can provide fruit for many months throughout the year, and for many years after their first planting (StrawberryPlants.org). In 2009 alone, over 2.8 billion pounds of strawberries were produced for a profit of $2.1 billion in the United States (Mann). Over 38, 614 acres of Northern and Southern California farmland is devoted to the strawberry crop, about 66% of total United States production, and an increase of four-fold from the 1970s.
Optimum cultivation specifications require that the area for strawberry planting have an average temperature between 50⁰F and 70⁰F. Strawberries need constant sunlight to produce the largest yields. But the location should also have an average length of daylight less than 14 hours per day and a cool to warm temperature to prevent overheating or drying out the soil (StrawberryPlants.org). Strawberries also require a consistent supply of water to maximize yields each year. Mean precipitation requirements for strawberries are 24-30 inches, though irrigation of about 10 inches during a normal growing season is expected in California to since strawberries need about an inch of water each day during the growing season (Vossen). Any incoming water significantly greater than 30 inches does not improve annual harvest and may actually deter growth because sitting in stagnant water accelerates fruit rot.
By taking into account de facto uses of irrigation within California agriculture, average rainfall, then only needs to be between 15 and 20 inches (total needed – 10 inches of irrigation). Constant irrigation throughout the plant’s reproductive growth stages substitutes for natural rainfall, but the intent of the farmer is to situate himself at a site that requires fewest additional inputs. Therefore, it’s expected that the farmer will want a site that averages in the high end of the spectrum, 18-20 inches of annual rainfall, so that he may use less irrigated water. Strawberries also need relatively flat ground, though a slight slope of 15% or less can help with soil drainage. A slight slope, with ample space for planting, is best for optimizing crop yields. Using these universal cultivation averages for the maximum yield production of strawberries, this report intends to ascertain the locations within California that have the highest potential for berry farming based on temperature, rainfall, slope, proximity to cities and proximity to waste sites.
Methods
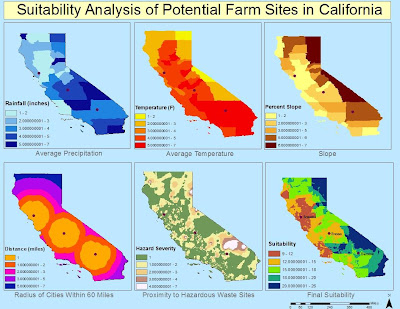
I ascertained annual data values for both precipitation and temperature in California from the state’s Water Resources Board. This climate data was provided by hydrologic region, of which there are ten in California, and then further narrowed by cities within the 58 California counties. The tabular data for these regional values include normal climate totals based on the 1971-2000 time period, in addition to recent monthly totals for temperature. Using this data, I manually created an excel table with information for county name, normal rainfall, and normal climate values which I then joined to the California counties attribute table gathered from the state’s Geospatial Clearinghouse. From this join, mean annual rainfall and temperature totals for each county polygon can be designated. The units for precipitation and temperature were left in inches and degrees Fahrenheit, respectively. See Climate Averages Map.
To evaluate the impact of slope on possible farm locations, I manually input elevation data for the state of California to determine area of high and low slopes. This data was included in the climate data excel table and manually joined to each county. From this information, I was able to use the spatial analyst toolbar to convert the vector slope information into convertible raster data. When the features were made into a raster output, I could use the surface analysis tool to calculate the slope percent for the various counties. See Slope Percent Map.
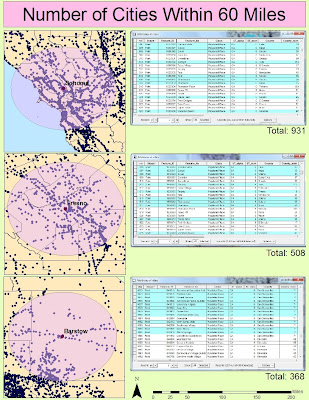
 To reduce the natural effects of decay on a recently harvested strawberry crop, berries must be harvested and transported to their location of sale quickly. Quick transport, as assumed by close proximity to cities, also minimizes costs associated with transportation, like fuel. The stipulation for closeness to cities is that they be within 60 miles of the proposed spot for the farm. This number is used as mathematical average for a city that is one hour away based on average road and highway speeds between 50 and 70 miles per hour. Based on the estimated size of the gas tank and miles per gallon for a farmer’s personal transportation truck, about the dimension and capacity of a medium-sized U-Haul truck, the tank can hold 30 gallons of unleaded gasoline with a fuel efficiency of 10mpg (Ninomiya). This volume allows the truck to drive roughly 300 miles without refueling. Having the maximum city market distance at 60 miles allows for the farmer to make two roundtrip drives on one tank of gas. This will sustain a fuel budget at $114, and eliminate superfluous cost from excess driving. To investigate the propinquity of cities to the three suggested locations, I implemented a buffer analysis around the three spots with a maximum distance of 60 miles. From this buffer, I could then select by location all the cities within the buffer distance to determine which city has the best location specs. I also used the line distance spatial analyst tool to provide another look at a buffer of where cities are within 60 miles, with secondary exterior distances of 30 miles, but to do so without all the clutter of the city points. The buffers help delineate the farm site with the most ideal situation in relation to markets. See City Buffer Map and City Proximity Map.
The last of the five maps required finding information from the EPA about national toxic waste facilities. I downloaded a point shapefile with the requisite information, but it was a national shapefile (EPA). I had to clip the shapefile according to the California counties mask so that only facilities in California were shown. Using the clipped points, I could then perform an Inverse Distance Weighted spatial interpolation to determine the variation in toxicity from a dense array of point locations. The IDW output showed the range of facility hazard in terms of an EPA risk scale. See Waste Map.
To then determine the overall suitability of the land in the towns of the possible farm locations, the information from each of the five previous maps were overlaid. To do so, all of the data values were given new scores from 1-7 using the reclassify functionality. The data was reclassified with 1 being the most suitable of the ranges of each of the five maps, and 7 being the least ideal of the maps’ data ranges. Using these new ranges, the values for each component were added together using the raster calculator function in spatial analyst. With an analysis mask of the state of California (using its size and coordinate system for the output of the analysis technique) the calculator function combined the five datasets and superimposed the resulting symbology over the state shapefile. The new map provides an encompassing examination of farm suitability, based on location, within California. With the city points appearing on top of the new suitability map, Will Grow can make an educated decision about where to move.
Results
The most suitable locations are in the lower end of the new range, where 9 is best and 26 is least suitable. According to the new scale that takes into account each component, Sonoma appears to be in the 9-12 range, making it the most ideal site, with Fresno coming in second and Barstow in third.

Conclusion
In looking at the individual factor maps, and the subsequent total suitability map, Will decides to accept the farm plot in Sonoma. Sonoma has average rainfall values of 18-22 inches, and a mean temperature of 59⁰F. It is also situated on mostly continuous flat terrain, and has over 900 cities within a 60 mile radius. Will’s decision is also in accordance with the regional crop database provided by the California Pest Management Center. The database offers a comprehensive list of crops grown in California based on various regions. In region 7, which includes Del Norte County, Sonoma County, Humboldt County, etc., dozens of crops are successfully grown, including strawberries. It is not the only growing region suitable enough to grow the strawberry crop, but it is the most productive. The city of Sonoma is, of course, in Sonoma County, putting the location of Will’s farm in the area of highest potential strawberry cultivation.
California Pest Management Center. “California Commercial Crop Database.” 2 March, 2011. http://www.wrpmc.ucdavis.edu/ca/cacrops/region4.html.
State of California. “Boundaries.” GIS Cal-Atlas Geospatial Clearing House. 14 Nov, 2008. Accessed 2 March, 2011. http://www.atlas.ca.gov/download.html
State of California. “Society.” GIS Cal-Atlas Geospatial Clearing House. 14 Nov, 2008. Accessed 2 March, 2011. http://www.atlas.ca.gov/download.html
State of California. “Regional Climate Data.” Department of Water Resources. 3 Feb, 2011. Accessed 2 March, 2011. http://www.water.ca.gov/floodmgmt/hafoo/csc/
Ninomiya, Kent. “What is the Gas Mileage of a U-Haul Truck?” 14 Feb, 2011. Accessed 2 March, 2011. http://www.ehow.com/about_4587090_gas-mileage-u_haul-truck_.html.
“Growing Strawberries.” StrawberryPlants.org. Accessed 12 March, 2011. http://strawberryplants.org/2010/05/growing-strawberries/.
Vossen, Paul. “Growing Strawberries on the North Coast.” Accessed 12 March, 2011. http://cesonoma.ucdavis.edu/files/62257.pdf
Mann, Albert R. “US Strawberry Industry.” United States Department of Agriculture. March 2010. Accessed 2 March, 2011. http://usda.mannlib.cornell.edu/MannUsda/viewDocumentInfo.do?documentID=1381.
US Environmental Protection Agency. “EPA and State Treatment, Storage, Disposal.” February 2011. Accessed 8 March, 2011.
